
<link rel="stylesheet" href="https://giftbit.cloudfworkers.workers.dev/hubfs/hub_generated/template_assets/1/170721122877/1790610943700/template_custom-styles.min.css">
Big site graphics

Giftbit Holiday Digital Rewards Index 2025

Month-to-month business gift card spending, the holiday surge, and
what brand categories win the season

Published September 28th, 2026

94%

Higher average monthly reward value in Nov–Dec vs. the Jan–Oct baseline

28%

Share of all 2025 reward value redeemed in just two months

142%

Lift in combined consumer + employee incentive value, Nov–Dec

7.4X

December employee-incentive value vs. the Jan–Oct monthly average

Contents

Methodology

Figures reflect reward sending, redemption value, and claim timing across Giftbit's platform for calendar year 2025, based on thousands of customers' sending. Spending and category figures are indexed to each category's January–October monthly average (baseline = 100%); the brand category breakdown is indexed to the September–October average; claim-time figures are reported as median minutes to claim, rather than average. Outlier single-day claim batches, isolated bulk sends that would otherwise distort a single month's result, were identified and excluded from claim-time figures.

Key findings

Takeaways: what the 2025 holiday reward season looked like

The holiday reward season isn't one spike, it's two. Giftbit's 2025 platform data shows loyalty rewards peaking in November and employee rewards peaking in December, pushing total reward value to 2.5× the January–October monthly average by year-end.

  • The season starts with loyalty in November. Loyalty rewards peak first, climbing 84% in November before easing back in December. 
  • Employee recognition arrives last, and hits hardest. December employee-incentive value reaches 7.4× the Jan-Oct monthly average, consistent with bonuses, holiday recognition, and year-end budgets landing almost entirely in the final weeks of the year.
  • Team celebrations follow their own three-moment calendar. Two smaller peaks in May and August occur, then a significantly larger December surge (742%) point to distinct occasions rather than a steady ongoing gift-giving rhythm.
  • Recipients spend holiday rewards on practical items. December's steepest category gains are grocery (+1,067%), sporting goods (+475%), toys (+275%), and apparel (+257%), for practical, and immediate-use. Travel and hospitality barely moved (+27%), suggesting recipients spend holiday reward value on the season itself rather than saving it toward aspirational purchases like travel.

The Holiday Boost

When does holiday reward spending peak? 

For ten months of 2025, monthly reward value on Giftbit's platform stayed within 12 points of its January–October average. Then it broke upward: November came in 39% above average, and December reached 2.5× the average month. No single campaign drove it. Loyalty programs ramped up first, employee budgets landed last, and the categories recipients spent on shifted along with them. 
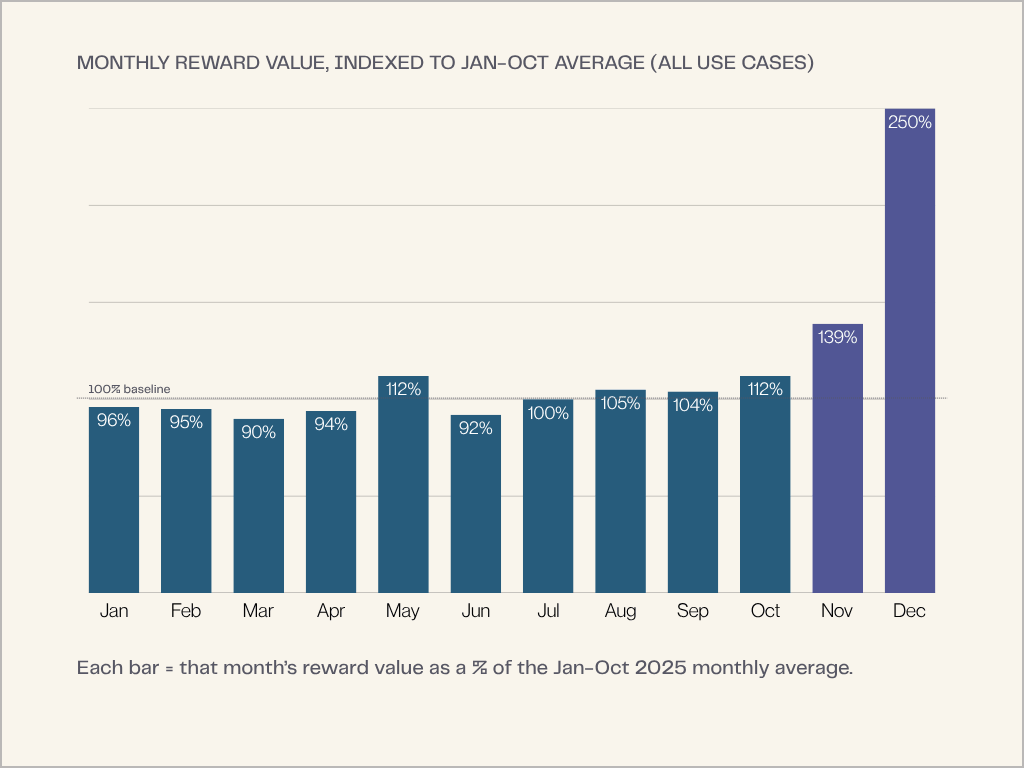
Reward value holds flat until November, then reaches 2.5× by December

Indexed against the January–October monthly average, reward value holds close to flat for ten months, then breaks sharply upward. November comes in 39% above baseline; December reached 2.5× the average month.
 

Monthly reward value 250% more than average Jan-Oct baseline in December.


Percentage of gift card spending for specific use case categories per month

This table shows each month as a % of the Jan-Oct 2025 dollar average (baseline 100%).

Month All Use Cases Consumer+Employee Consumer Incentives Employee Incentives Loyalty (all use cases) Team Celebrations (all use cases)
Jan 96% 116% 130% 60% 84% 36%
Feb 95% 96% 102% 71% 102% 47%
Mar 90% 80% 83% 69% 117% 36%
Apr 94% 87% 87% 87% 79% 46%
May 112% 105% 92% 158% 119% 53%
Jun 92% 100% 104% 86% 99% 41%
Jul 100% 100% 111% 55% 106% 33%
Aug 105% 121% 87% 257% 93% 516%
Sep 104% 91% 96% 72% 95% 67%
Oct 112% 104% 108% 85% 105% 125%
Nov 139% 153% 154% 151% 193% 55%
Dec 250% 331% 228% 742% 154% 1346%


Consumer and employee incentives drive the Q4 surge

Combined consumer and employee incentive value ran 142% higher in November and December than the ten-month baseline, outpacing the all-use-case average and confirming these two categories are the primary driver of the Q4 surge.

Consumer and employee reward gift card value up 153% in November and 331% in December compared to Jan-Oct baseline.

Average monthly reward value

Average monthly reward value across all use cases was 94% higher in November and December than during January–October.

Month All Use Cases Vs. Jan-Oct Average
Jan 96% -4%
Feb 95% -5%
Mar 90% -10%
Apr 94% -6%
May 112% +12%
Jun 92% -8%
Jul 100% 0%
Aug 105% +5%
Sep 104% +4%
Oct 112% +12%
Nov 139% +39%
Dec 250% +150%

Consumer and employee incentives

Consumer and employee incentives drove the increase, with average monthly reward value 142% higher in November and December than during January–October.

  Consumer+Employee
Jan–Oct baseline 100%
Nov 153%
Dec 331%
Nov–Dec average 242%
% higher than baseline 142%

Loyalty Incentives

Loyalty rewards peak first, in November

Loyalty rewards are the earliest movers in the Q4 calendar. Volume climbs steadily through October before spiking 84% in November, well ahead of the broader holiday curve, then eases back in December as programs that front-loaded their sends in Q4 wind down. This timing lines up with how loyalty programs typically operate: rather than reacting to the holiday season itself, many are built around retention checkpoints and year-end "thank you" sends that businesses schedule early, both to beat the December crunch and to keep engagement high heading into a new program year. The result is a loyalty spending curve that peaks before the broader holiday surge, not during it.

Loyalty and Employee rewards move on different clocks during the holiday season. Loyalty-specific consumer rewards peaked first in November, up 84% month-over-month and 93% above the ten-month average. Then they eased back in December.

Loyalty incentive gift card spending peaks in November at 193% of Jan-Oct baseline, and eases back to 154% in December.

Loyalty reward data

Month Volume % (of Jan–Oct Avg) % Increase / Decrease (MoM) Percentage of year
Jan 84% — 6.2%
Feb 102% +22.0% 7.6%
Mar 117% +14.2% 8.7%
Apr 79% −32.7% 5.9%
May 119% +51.4% 8.8%
Jun 99% −16.7% 7.4%
Jul 106% +6.2% 7.9%
Aug 93% −11.7% 6.9%
Sep 95% +1.7% 7.1%
Oct 105% +10.6% 7.8%
Nov 193% +84.1% 14.3%
Dec 154% −20.2% 11.4%

Employee Appreciation

Employee rewards peak last, at 7.4× in December

Employee incentives tell another story showing a slow build through most of the year, with a blip in May, another bump in August, then a landslide in December, when reward value across the platform hits 7.4x the January–October monthly average. Annual bonuses, holiday appreciation gifts, and team celebrations all land in the same few-week window. 

The steepest surge is December's employee rewards

Employee-incentive reward value hit 7.4 times the January–October monthly average in December, the largest single-month multiple of any use case tracked, evidence that year-end budgets land almost entirely in the final weeks of the fiscal year.

General employee rewards

Reward value stays low for most of the year, with brief spikes in May, and August, with November beginning to ramp up, but December surging past all of them.

Employee reward gift card spending surges in December at 742% of the Jan-Oct baseline.


Team celebrations have two peaks, August and December

Team Celebrations in particular were the most concentrated of all reward categories. 56.1% of the year's total team-celebration value was claimed in December alone, with a smaller notable spike in August (accounting for another 21.5% of the year). Together, these two months made up over three-quarters of all team-celebration spend in 2025.

Team celebrations gift card spending has two peaks, 516% in August and 1346% in December compared to Jan-Oct average.

General employee rewards

Month Volume % (of Jan–Oct Avg) % Increase / Decrease (MoM) Percentage of year
Jan 60% — 3.2%
Feb 71% +18.2% 3.8%
Mar 69% −3.8% 3.6%
Apr 87% +27.6% 4.6%
May 158% +80.5% 8.3%
Jun 86% −45.4% 4.5%
Jul 55% −35.6% 2.9%
Aug 257% +363.3% 13.6%
Sep 72% −72.2% 3.8%
Oct 85% +18.6% 4.5%
Nov 151% +78.2% 8.0%
Dec 742% +391.4% 39.2%

Team celebrations

Month Volume % (of Jan–Oct Avg) % Increase / Decrease (MoM) Percentage of year
Jan 36% — 1.5%
Feb 47% +31.4% 2.0%
Mar 36% −24.4% 1.5%
Apr 46% +28.9% 1.9%
May 53% +15.2% 2.2%
Jun 41% −22.3% 1.7%
Jul 33% −21.0% 1.4%
Aug 516% +1,483.4% 21.5%
Sep 67% −86.9% 2.8%
Oct 125% +86.1% 5.2%
Nov 55% −56.1% 2.3%
Dec 1346% +2,343.7% 56.1%

Brand Category Spikes

Which gift card categories grow most during the holidays?

Reward recipients aren't just receiving more during the holidays. They're spending it differently. In December grocery rewards rose 1067% during the holiday period, sporting goods jumped 475%, and apparel climbed 257%. Against that backdrop, travel and hospitality's 27% increase isn't holiday growth so much as a relative decline. Since overall reward spending is running well over 100% above baseline in the same period, a category growing only 27% is capturing a shrinking share of holiday dollars, not a growing one. Read together, the data suggests recipients are using holiday rewards to cover the season itself: hosting, gifting, gearing up for winter activities, rather than banking them toward future travel plans.

That flexibility is built into how Giftbit rewards work. Recipients aren't locked into a single retailer. Depending on how a program is set up, they can choose from Giftbit's full catalog of regional brands, everything from grocery and big-box retailers to specialty and hospitality brands, or select from a curated shortlist that a business sets in advance. The category shifts in this report reflect that choice in action: when recipients have the freedom to pick where their reward goes, spending patterns shift in step with the season, rather than staying fixed to whatever brand a business might have chosen for them.


What people claimed: December's biggest movers

Comparing December reward spend to the September–October baseline shows how differently recipients chose across categories during the season. Grocery, sporting goods, and apparel rewards rose 1067%, 475%, and 257% respectively in the holiday period, while travel and hospitality rewards grew just 27%.

Grocery gift cards claimed 1067% more in December than Jan-Oct average.

Category increase / decrease for November and December

Category Nov increase/decrease vs Sep-Oct average Dec increase/decrease vs Sep-Oct average
Grocery 131.60% 1067.10%
Sporting Goods & Outdoor 56.20% 474.80%
Toys & Kids 179.40% 274.70%
Apparel & Fashion 63.40% 256.90%
Home & Big-Box Retail 30.20% 218.90%
Books & Media 25.80% 209.80%
Pet 18.00% 165.30%
Prepaid/Generic Reward Cards 49.50% 133.40%
Charity & Gift Aggregators -2.40% 115.10%
Marketplace & E-commerce 44.70% 113.10%
Fuel & Convenience 5.90% 109.50%
Beauty, Health & Pharmacy 32.20% 91.00%
Restaurants & Fast Food 14.70% 90.80%
Auto -37.90% 85.10%
Food & Grocery Delivery 3.80% 71.90%
Entertainment, Gaming & Streaming 37.80% 71.20%
Rideshare -4.00% 68.50%
Electronics & Tech -3.40% 64.20%
Travel & Hospitality 5.60% 26.80%

Time-to-Claim

Why holiday rewards take longer to claim

The platform's slowest month to claim a reward is also its busiest, a pattern that holds across nearly every reward category.

Platform-wide volume peaks in December and so do claim times. With the exception of Electronics & Gaming, and Prepaid categories, December is the slowest time to claim. Median claim time reaches 162 minutes in December, roughly 2-4X the rest of the year, and December alone accounts for 13.1% of the entire year's claimed rewards, the largest single-month share of any month tracked.

Median claim times jump to 162 minutes in December, roughly 2-4X more than the rest of the year.


Grocery sees the sharpest slowdown

Nearly one in three grocery gift card claims made all year happens in December, and those claims take longer to redeem than at any other time.

Grocery rewards show the most extreme version of the December pattern. Median claim time jumps to 1,318 minutes in December, up from a range of 86 to 346 minutes across the rest of the year, and nearly a third of all grocery reward claims for the entire year (30.6%) happen in that single month.

Grocery gift cards are claimed slowest at 1,318 minutes in December.


Even fast-claiming brands slow down in December

Some of the platform's fastest-claimed brands slow down dramatically in December, suggesting a seasonal shift in recipient behavior rather than simple inbox backlog.

Starbucks rewards are typically claimed within 7 to 9 minutes in the first few months of the year, but that climbs to 168 minutes in December, a 24-fold increase. 

Starbucks gift cards are claimed far slower in December at 168 minutes vs 14 minutes in January.


Amazon shows the same pattern: claim time rises from 10 minutes in January to 83 minutes in December, an 8-fold increase.

Amazon gift cards are claimed slower in December at 83 minutes vs 10 minutes in January.

December is the slowest month to claim a reward across most categories and brands tracked, from grocery gift cards to Starbucks to Amazon. The size of that slowdown varies widely, grocery's median claim time rises over 7x, Starbucks nearly 24x, but the pattern isn't universal.

The prepaid & gaming exception

Prepaid cards and gaming entertainment rewards show no December slowdown at all, staying just as fast, or faster, than the rest of the year. Giftbit's 2025 platform data can't say why most categories slow down while a few stay instant, but the split itself is informative: rewards that are redeemed for immediate, single-purpose use (a gaming top-up, a prepaid balance) don't get caught in the same holiday delay that slows down considered, multi-option claims like grocery or retail gift cards.

General claim time in minutes (all categories combined)

Month Median claim time % of annual
Jan 14 min 7.3%
Feb 40 min 8.3%
Mar 41 min 7.7%
Apr 39 min 9.2%
May 62 min 8.7%
Jun 98 min 7.0%
Jul 55 min 7.2%
Aug 78 min 7.2%
Sep 35 min 7.1%
Oct 73 min 8.6%
Nov 45 min 8.7%
Dec 162 min 13.1%

By category, median claim time in minutes

Category Jan Feb Mar Apr May Jun Jul Aug Sep Oct Nov Dec
Delivery/Rideshare 0 0 0 2 1 1 1 0 0 0 0 6
Electronics/Gaming 1 39 1 3 2 5 110 20 1 5 0 0
General Retail/Marketplace 11 16 19 23 55 103 25 56 21 51 29 114
Restaurant/QSR 8 12 97 20 40 56 39 32 64 76 74 198
Grocery 186 195 335 121 113 153 86 217 153 186 346 1318
Prepaid Card 405 521 675 353 635 457 393 489 324 323 308 356
Casual Dining 443 1182 490 1243 534 762 473 1384 1596 1320 1653 3798
Department Store 1072 1531 1680 3163 1160 340 500 2904 1698 1227 1164 4559

By category, % of annual claim volume

Category Jan Feb Mar Apr May Jun Jul Aug Sep Oct Nov Dec
Delivery/Rideshare 8.3% 8.1% 7.9% 9.7% 8.1% 6.8% 8.1% 7.1% 7.0% 8.1% 7.3% 13.4%
Electronics/Gaming 6.0% 6.6% 4.9% 6.7% 5.6% 6.6% 10.2% 8.2% 7.8% 13.1% 11.0% 13.5%
General Retail/Marketplace 7.6% 8.7% 8.1% 10.2% 9.2% 7.3% 7.2% 7.3% 7.2% 7.9% 8.2% 11.2%
Restaurant/QSR 8.5% 9.3% 10.7% 9.3% 10.9% 6.4% 5.6% 6.7% 6.8% 7.5% 7.7% 10.8%
Grocery 4.0% 3.9% 4.2% 6.2% 11.8% 7.0% 4.8% 5.6% 5.1% 9.0% 7.9% 30.6%
Prepaid Card 6.3% 7.8% 6.0% 7.6% 6.4% 5.9% 6.6% 6.5% 7.0% 9.7% 11.2% 19.1%
Casual Dining 5.8% 9.2% 8.2% 7.8% 9.9% 7.0% 6.3% 7.7% 6.2% 7.7% 8.1% 16.2%
Department Store 6.0% 6.9% 6.2% 5.8% 7.6% 6.9% 5.4% 8.8% 5.6% 9.9% 9.6% 21.2%

Starbucks median claim times and % of annual share

Month Median claim time % of annual
Jan 7 min 9.6%
Feb 8 min 9.7%
Mar 9 min 9.7%
Apr 9 min 10.1%
May 17 min 11.7%
Jun 22 min 5.3%
Jul 21 min 5.7%
Aug 12 min 6.4%
Sep 27 min 6.5%
Oct 52 min 7.3%
Nov 49 min 7.4%
Dec 168 min 10.7%

Amazon median claim times and % of annual share

Month Median claim time % of annual
Jan 10 min 8.1%
Feb 9 min 9.3%
Mar 11 min 8.6%
Apr 14 min 10.9%
May 26 min 9.1%
Jun 30 min 6.6%
Jul 17 min 7.1%
Aug 26 min 6.7%
Sep 16 min 7.4%
Oct 21 min 7.4%
Nov 24 min 8.2%
Dec 83 min 10.6%

Prepaid Cards (Visa + Mastercard) median claim times and % of annual share

Month Median claim time % of annual
Jan 510 min 6.9%
Feb 626 min 7.9%
Mar 796 min 5.6%
Apr 434 min 6.7%
May 998 min 6.1%
Jun 408 min 6.2%
Jul 346 min 6.7%
Aug 419 min 6.7%
Sep 300 min 7.0%
Oct 268 min 9.9%
Nov 296 min 11.5%
Dec 308 min 18.9%

Planning

How to plan your 2026 holiday and year-end rewards

Plan holiday rewards in two waves: schedule loyalty and customer sends by late October, and lock in employee recognition budgets before December. In Giftbit's 2025 platform data, loyalty rewards peaked in November and employee rewards peaked in December, so programs that start planning in December have already missed the first wave.

 

Leif-1“Timing is an important part of creating a powerful reward experience. The holiday rush can be a blur...Creating these moments is powerful and simple, and they last through the busy holidays to motivate in the new year ahead."  — Leif Baradoy, CEO Giftbit


By late October: schedule loyalty and customer thank-you sends

Loyalty rewards peak in November, rising 84% from October. If your customer appreciation sends aren't scheduled by Halloween, you'll land after most programs already have.

By mid-November: finalize employee recognition budgets and recipient lists

December employee-reward value reaches 7.4× the monthly average, driven by bonuses, holiday recognition, and year-end budget. Settle approvals, recipient lists, and messaging before December so the final weeks are about sending, not sign-offs.

Early to mid-December: send rewards meant for holiday use

December is the slowest month to claim a reward, with a median claim time of 162 minutes. If a reward is meant to cover holiday meals or gifts, give recipients time to claim and use it before the break.

Give recipients choice, because holiday spending shifts

Holiday spending shifts toward grocery, sporting goods, toys, and apparel, while travel barely grows. Offering a full catalog or curated shortlist lets recipients' choices follow the season, instead of locking them into a brand picked in October.


FAQ

Frequently asked questions about holiday gift card spending

When does holiday gift card spending peak in a year?

According to Giftbit platform data from the 2025 calendar year, monthly reward value stays within a narrow band for most of the year, then breaks sharply upward starting in November. December closes the year at 250% of the January–October monthly average, a 150-point jump, with November coming in at 139% (up 39%).

How much higher is reward spending during the holidays compared to the rest of the year?

Average monthly reward value across all use cases was 94% higher in November and December combined than during January–October. Those two months alone accounted for 28% of all 2025 reward value redeemed on Giftbit's platform.

Do loyalty rewards or employee rewards peak first?

Loyalty rewards move first. They peaked in November, rising 84% month-over-month and reaching 93% above the ten-month average, then eased back in December. Employee incentives move on the opposite clock: they build slowly through the year and hit their peak in December, at 7.4 times the January–October monthly average, the sharpest single-month multiple of any use case tracked in this report.

What percentage of annual employee reward value is sent in December?

December alone accounts for 13.6% of the year's general employee reward volume. Team celebration rewards are even more concentrated: 56.1% of the year's total team-celebration value is claimed in December, with a smaller secondary spike in August (21.5%), together making up over three-quarters of all team-celebration spend in 2025.

Which gift card category sees the biggest increase during the holidays?

Grocery rewards rise the most, up 1,067% in December compared to the September–October baseline. Sporting goods (+475%), toys (+275%), and apparel (+257%) follow. Travel and hospitality rewards move the least, up just 27%, the smallest increase of any category tracked.

How long does it take recipients to claim a gift card in December compared to the rest of the year?

December is the slowest month to claim a reward on Giftbit's platform. Median claim time reaches 162 minutes, roughly 2–4× the rest of the year. December also accounts for 13.1% of the entire year's claimed rewards, the largest single-month share of any month tracked.

Which category has the fastest holiday claim times?

Delivery and rideshare rewards are claimed the fastest of any category, holiday season included. Median claim time stays at or near 0 minutes for most of the year, and even in December, when nearly every other category slows down sharply, delivery and rideshare rewards are still claimed in a median of 6 minutes, a small fraction of the platform-wide December median of 162 minutes.

When should businesses send holiday gift cards to employees?

Aim for early to mid-December, and have budgets and recipient lists approved before December starts.

According to Giftbit's 2025 platform data, December employee-reward value reached 7.4× the January–October monthly average, and December alone accounted for 39% of the year's employee-reward value. Because December is also the slowest month to claim a reward, sending earlier in the month gives employees time to claim and use their rewards before the holidays.

What gift cards do people choose during the holidays?

During the holidays, recipients choose practical, everyday categories over travel or big-ticket purchases. According to Giftbit's 2025 platform data, December reward value rose 1,067% for grocery compared with the September–October average, followed by sporting goods and outdoor (475%), toys and kids (275%), and apparel (257%). Travel and hospitality grew just 27%, suggesting recipients spend holiday rewards on the season itself rather than saving them for future trips.

Do holiday gift cards take longer to claim?

Yes. According to Giftbit's 2025 platform data, the median time to claim a reward rose to 162 minutes in December, compared with 35 to 98 minutes from February through November. Grocery rewards slowed the most, to a median of about 22 hours in December. Not every category slows down: prepaid cards and gaming rewards were claimed just as quickly in December as the rest of the year.


Planning your year-end rewards?

Get them scheduled before the December rush.

Latest articles from the blog

Market Researchers: Is It Time to Review Your Gift Card Provider?
Digital Gift Cards
Market Researchers: Is It Time to Review Your Gift Card Provider?
by Aaron Zide
Make your research budget work harder. See what to ask your gift card provider about claim data, reporting, and unclaimed rewards.
How to Buy, Send, and Track Bulk Gift Cards for Research Participants
Academic & Medical Research Incentives
How to Buy, Send, and Track Bulk Gift Cards for Research Participants
by Giftbit
Learn how to buy, send, and track bulk gift cards for research participants, from IRB approvals and spreadsheet delivery to privacy, funding methods, and fees.
How Businesses Can Send Fast, Flexible Digital Disbursements At Scale
Payouts & Disbursements
How Businesses Can Send Fast, Flexible Digital Disbursements At Scale
by Giftbit
Not all digital disbursements work the same. Compare methods for incentives, rebates, and rewards, and choose a platform that can scale.